Multiple Choice
Identify the
choice that best completes the statement or answers the question.
|
|
|
1.
|
A survey typically records many variables of interest to the researchers
involved. Below are some of the variables from a survey conducted by the U.S. Postal
Service. Which of the variables is categorical?
A. | County of residence | B. | Number of people, both adults and children,
living in the household | C. | Total household income, before taxes, in
1993 | D. | Age of respondent | E. | Number of rooms in the
dwelling |
|
|
|
2.
|
A particularly common question in the study of wildlife behavior involves
observing contests between "residents" of a particular area and
"intruders." In each contest, the "residents" either win or lose the
encounter (assuming there are no ties). Observers might record several variables, listed
below. Which of these variables is categorical?
A. | The duration of the contest (in seconds). | B. | The number of
animals involved in the contest. | C. | Whether the "residents" win or
lose. | D. | The total number of contests won by the "residents." | E. | None of
these. |
|
|
|
3.
|
Deciduous forests in the Eastern United States often have many different species
of oak trees. Below is a frequency distribution for five different species of oaks found in
sample plots a certain forest. | Species of oak | Black | Red | Scarlet | Pin | White | | Frequency | 25 | 14 | 12 | 8 | 40 | | | | | | |
Which of the following
pie charts describes the same distribution?
|
|
|
Scenario 1-1
A review of voter registration records in a small town
yielded the following table of the number of males and females registered as Democrat, Republican, or
some other affiliation. | | Male | Female | Democrat | 300 | 600 | Republican | 500 | 300 | Other | 200 | 100 | | | |
|
|
|
4.
|
Use Scenario 1-1 Your percentage from question number 12 is part of
A. | The marginal distribution of political party registration. | B. | The marginal
distribution of gender. | C. | The conditional distribution of gender among
Democrats. | D. | The conditional distribution of political party registration among
males. | E. | The conditional distribution of males within gender. |
|
|
|
5.
|
Use Scenario 1-1. The proportion of registered Democrats that are male is
A. | 300 | B. | 33 | C. | 0.33 | D. | 0.30 | E. | 0.15 |
|
|
|
Scenario 1-2
Below is a two-way table summarizing the number of
cylinders in selected car models manufactured in six different countries in the
1990’s. | | Number of cylinders | | | | 4 | 5 | 6 | 8 | Total | France | 0 | 0 | 1 | 0 | 1 | Germany | 4 | 1 | 0 | 0 | 5 | Italy | 1 | 0 | 0 | 0 | 1 | Japan | 6 | 0 | 1 | 0 | 7 | Sweden | 1 | 0 | 1 | 0 | 2 | U.S.A. | 7 | 0 | 7 | 8 | 22 | Total | 19 | 1 | 10 | 8 | 38 | | | | | | |
|
|
|
6.
|
Use Scenario 1-2. The percentage of all cars listed in the table with 4-cylinder
engines is
A. | 19%. | B. | 21%. | C. | 50%. | D. | 80%. | E. | 91%. |
|
|
|
7.
|
Use Scenario 1-2. The percent of cars with 4-cylinder engines that are made in
Germany is
A. | 10.5%. | B. | 21%. | C. | 50%. | D. | 80%. | E. | 91%. |
|
|
|
8.
|
Use Scenario 1-2. Which of the following is a marginal distribution?
A. | The percentage of all four-cylinder cars manufactured in Germany. | B. | The number of
four-cylinder cars manufactured in Germany. | C. | The percentage of all cars manufactured in each
country. | D. | The percentage of cars manufactured in Germany for each number of
cylinders. | E. | The numbers 4, 5, 6, 8. |
|
|
|
9.
|
The table below shows the results of the New Hampshire Democratic Presidential
Primary on January 8, 2008. Candidate | Percentage of
votes | Hillary Clinton | 39 | Barack
Obama | 37 | John Edwards | 17 | Bill Richardson | 5 | Other | 2 | | |
Which of the following
lists of graphs are all appropriate ways of presenting these data? A. | Bar graph, Pie Chart, Box plot | B. | Bar graph, Box plot | C. | Bar graph, Pie
Chart | D. | Bar Graph only | E. | Pie Chart only |
|
|
|
10.
|
One way economists measure the health of the real estate market is by counting
“housing starts,” or the number of permits issued for construction of new homes.
Below is a graph displaying housing starts (in thousands) in the United States from 2006 to
2009. 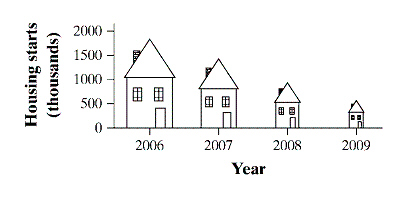 What is the principle weakness of this graphical
presentation of data? A. | The “thousands” label on the vertical scale is confusing and
misleading. | B. | The data only shows housing starts for four years, which is not enough time to
identify a meaningful trend. | C. | Using proportionally-sized pictograms
exaggerates the difference between years. | D. | Data of this type should only be displayed in a
pie chart. | E. | It is unclear which dimension of the house represents the number of housing starts
for that year. |
|
|
|
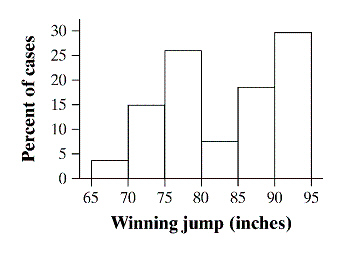
Figure 1-1
|
|
|
11.
|
Use Figure 1-1. Based on this histogram, the percentage of the winning
jumps that were at least 80 inches is about
A. | 10%. | B. | 35%. | C. | 45%. | D. | 55%. | E. | 90%. |
|
|
|
12.
|
The histogram below shows the distribution of heights for 100 randomly selected
school children in Great Britain. 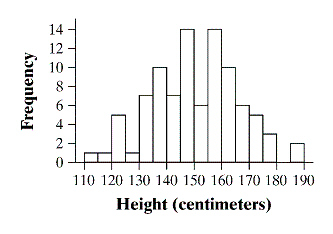 Which of the following descriptions best fits
this distribution? A. | Roughly uniform, centered at about 150, range 110 to 190. | B. | Roughly uniform,
centered at about 150, range 80 | C. | Roughly symmetric, centered at about 150, range
110 to 190. | D. | Roughly symmetric, centered at about 150, range 80. | E. | Roughly symmetric,
centered at about 150, range about 135 to 165. |
|
|
|
Scenario 1-3
For a physics course containing 10 students, the maximum
point total for the quarter was 200. The point totals for the 10 students are given in the
stemplot below. | 11 | 6 | 8 | | | 12 | 1 | 4 | 8 | | 13 | 3 | 7 | | | 14 | 2 | 6 | | | 15 | | | | | 16 | | | | | 17 | 9 | | | | | | |
|
|
|
13.
|
Use Scenario 1-3. The median point total for this class is
A. | 130. | B. | 130.5. | C. | 133. | D. | 134.4. | E. | 137. |
|
|
|
14.
|
The median age of five elephants at a certain zoo is 30 years. One of the
elephants, whose age is 50 years, is transferred to a different zoo. The median age of the
remaining four elephants is
A. | 40 years. | B. | 30 years. | C. | 25
years. | D. | less than 30 years. | E. | Cannot be determined from the information
given. |
|
|
|
15.
|
A set of data has a mean that is much larger than the median. Which of the
following statements is most consistent with this information?
A. | The distribution is symmetric. | B. | The distribution is skewed
left. | C. | The distribution is skewed right. | D. | The distribution is
bimodal. | E. | The data set probably has a few low outliers. |
|
|
|
16.
|
Which of the following graphs can be used to summarize the data in a two-way
table?
A. | Dot plot | B. | Segmented bar graph | C. | Box
plot | D. | Stem plot | E. | Histogram |
|
|
|
Scenario 1-4
Mr. Williams asked the 26 seniors in his statistics class
how many A.P. courses they had taken during high school. Below is a dot plot summarizing the
results of his survey. 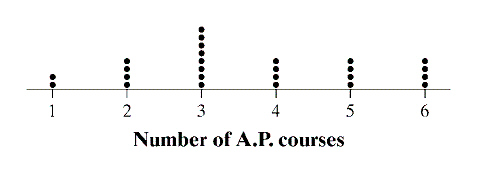
|
|
|
17.
|
Use Scenario 1-4. The median number of A.P. courses taken by Mr.
Williams’s students is
A. | 2 | B. | 3 | C. | 3.5 | D. | 4 | E. | cannot be determined
from the information given. |
|
|
|
18.
|
The mean age of four people in a room is 30 years. A new person whose age
is 55 years enters the room. The mean age of the five people now in the room is
A. | 30. | B. | 35. | C. | 37.5. | D. | 40. | E. | Cannot be determined
from the information given. |
|
|
|
Scenario 1-5
A sample was taken of the salaries of 20 employees of a
large company. The following boxplot shows the salaries (in thousands of dollars) for this
year. 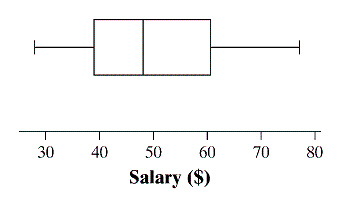
|
|
|
19.
|
Use Scenario 1-5. Based on the boxplot, which of the following statements is
true?
A. | The maximum salary is between $60,000 and $70,000. | B. | The minimum salary
is $20,000. | C. | The range of the middle half of the salaries is about $20,000. | D. | The median salary is
about $40,000. | E. | 25% of the employees make more than $70,000. |
|
|
|
20.
|
Use Scenario 1-5. Based on the boxplot, the five-number summary is
A. | 28, 39, 48, 60.5, 77. | B. | 28, 41, 48, 58, 77. | C. | 28, 39, 51, 58,
77. | D. | 28, 41, 51, 60.5, 77. | E. | 26, 39, 48, 60.5,
81. |
|
|
|
21.
|
You catch 10 cockroaches in your bedroom and measure their lengths in
centimeters. Which of these sets of numerical descriptions are all measured in
centimeters?
A. | median length, variance of lengths, largest length | B. | median length, first
and third quartiles of lengths | C. | mean length, standard deviation of lengths,
median length | D. | mean length, median length, variance of lengths. | E. | both (B) and
(C) |
|
|
|
22.
|
The first sentence in Henry James’s novel The Turn of the Screw has
62 words. The five number summary for the lengths of those words is 1,2,3.5,6,12.
According to the 1.5 x IQR rule for identifying outliers, does this distribution have any
outliers?
A. | No, there are no outliers. | B. | Yes, there is at least on high outlier but no
low outliers. | C. | Yes, there is at least one low outliers, but no high outliers. | D. | Yes, there is at
least one high and one low outlier. | E. | There is not enough information given to
determine if there are any outliers. |
|
|
|
23.
|
Different writers have different styles. One way to quantify this
difference is to compare the distribution of word lengths in their work. Below are parallel
boxplots describing the distributions of word lengths for the first 60 words in Henry James’s
The Turn of the Screw, J.K. Rowling’s Harry Potter and the Chamber of
Secrets, and Chapter 1 of your statistics textbook (labeled “Starnes” below). 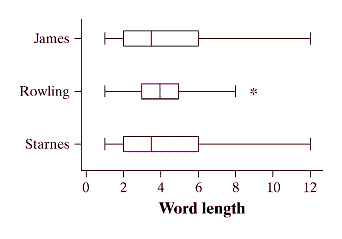 Based on the graphs, which one of the following statements must be true? A. | Dot plots of the distributions of James’s word lengths and Starnes’s word
lengths are identical. | B. | The longest word in the distribution of
Rowling’s word lengths is short than 25% of the word in the “James”
distribution. | C. | The range of Rowling’s word lengths is smaller than the interquartile range of
Starnes’s word lengths. | D. | The median word length for Rowling is longer
than for either Starnes or James. | E. | 75% of the words in Rowling’s
distribution are longer than the median word length in Starnes’s
distribution. |
|
|
|
24.
|
The stemplot below shows the number of home runs hit in 2008 by members of the
Philadelphia Phillies, who won major League Baseball’s World Series that year. (Each of
the 13 players who appeared in at least half the Phillies’ games that year is included).
Note that 4 | 8 represents 48 home runs. | 0 | 0 | 2 | 4 | | 0 | 9 | 9 | 9 | | 1 | 1 | 4 | 4 | | 1 | | | | | 2 | 4 | | | | 2 | | | | | 3 | 3 | 3 | | | 3 | | | | | 4 | | | | | 4 | 8 | | | | | | |
The five number summary for these data is: A. | 0, 9, 1, 3, 8 | B. | 0, 9, 11, 33, 48 | C. | 0, 6.5, 11, 28.5,
48 | D. | 0, 6.5, 11, 28.5, 33 | E. | 0, 4, 11, 24,
48 |
|
|
|
25.
|
The reversal of the direction of an association when a lurking variable is taken
into account is called
A. | a conditional association. | B. | lurking association. | C. | Simpson’s
paradox. | D. | negative association. | E. | independence. |
|